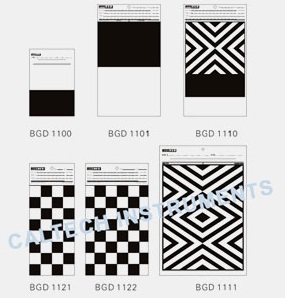
About Opacity Charts
Opacity Charts
Caltech India Offers Charts / Opacity Charts / Drawdown Charts. We Have Wide Range Of Drawdown Cards And Charts For Virtually Any Application And Coating Material. Stringent Equality Control During The Production Process Assures That They Have The Most Consistent Color And Gloss In The Industry. Test Charts Are Easy To Use And An Economical Substrate To Test A Variety Of Coating Properties, Such As Opacity, Spreading Rate, And Flow & Leveling Behavior. They Are Used For Testing Architectural, Industrial, Automotive, Wood Finishes Or Even Cosmetic Products e.g. Nail Polish . Depending On The Material Properties Of The Product To Be Tested And Its Usage Different Types Of Drawdown Cards Are Available.
Exceptional Precision for Visual Opacity TestingEngineered for demanding inspection tasks, Opacity Charts offer high-resolution grayscale differentiation, empowering users to confidently evaluate sample transparency and coverage. The ten-step grey scale guarantees accurate and repeatable readings, ensuring results you can trust across a wide range of applications.
Durable Design for Everyday UseCrafted from robust card or plastic and featuring a laminated protective surface, each chart withstands regular handling and repeated cleaning. Reusability means reduced operational costs, making these charts suitable for laboratories, manufacturing floors, and quality control checkpoints.
Versatile Applications Across MediaIdeal for use with paper, plastic, films, and ink samples, Opacity Charts provide reliable opacity comparison in both industrial and educational settings. Their manual, power-free operation enables quick assessments anywhere without the need for specialized equipment.
FAQs of Opacity Charts:
Q: How do I use an Opacity Chart for visual comparison of sample opacity?
A: To use an Opacity Chart, place your sample over the chart; visually compare its opacity against the ten-step grey scale. The scale helps estimate opacity levels from 0 to 100%, ensuring consistent and accurate evaluation without the need for additional equipment.
Q: What media can be assessed using these charts?
A: These charts are designed to evaluate the opacity of paper, plastic, films, and ink samples. The high-precision grey scale allows effective transparency measurements across diverse substrates, making them suitable in both research and production environments.
Q: When is it best to use an Opacity Chart?
A: Opacity Charts are ideal for use during quality control processes, product evaluations, and whenever quick visual assessment of sample opacity is needed. Their manual design means they can be employed instantly, without waiting for sensor-based devices.
Q: Where can I purchase Opacity Charts in India?
A: Opacity Charts are available through dealers, distributors, exporters, importers, manufacturers, producers, service providers, suppliers, and traders throughout India. Look for trusted suppliers who offer both individual and set box packaging options.
Q: What benefits does the reusable laminated design offer?
A: The protective laminated surface makes each chart resistant to wear and easy to clean, enabling prolonged reuse. This durability reduces the need for frequent replacements, ensuring reliable performance over extended periods in busy environments.
Q: What is the recommended storage environment for these charts?
A: For optimal longevity, store the Opacity Charts at temperatures between 10C and 40C with a maximum humidity of 75% (non-condensing). Proper storage helps maintain chart accuracy and protects the laminated surface from environmental stress.
Q: Is any power supply or sensor required for operation?
A: No external power supply is needed for these charts. Opacity measurement is performed through direct visual/manual observation, making them completely manual and convenient for immediate use anywhere.


 Send Inquiry

 English
 Spanish
 French
 German
 Italian
 Chinese (Simplified)
 Japanese
 Korean
 Arabic
 Portuguese